One week of MauiCoqui.com: What we know, and what we don’t
October 16, 2026 · Tim Storm
A week ago, MauiCoqui.com went public. Neighbors have started claiming their properties and reporting what they’re hearing, and I’ve spent several evenings driving around Haʻikū with microphones, listening for coqui and adding observations to the map.
We’re starting to see patterns. We’re also seeing just how much information is missing.
This isn’t a map of which homes have coqui and which don’t. It’s a map of where coqui have been detected, where someone looked or listened without detecting them, and where we still don’t have enough information.
That’s an important distinction, especially this early.
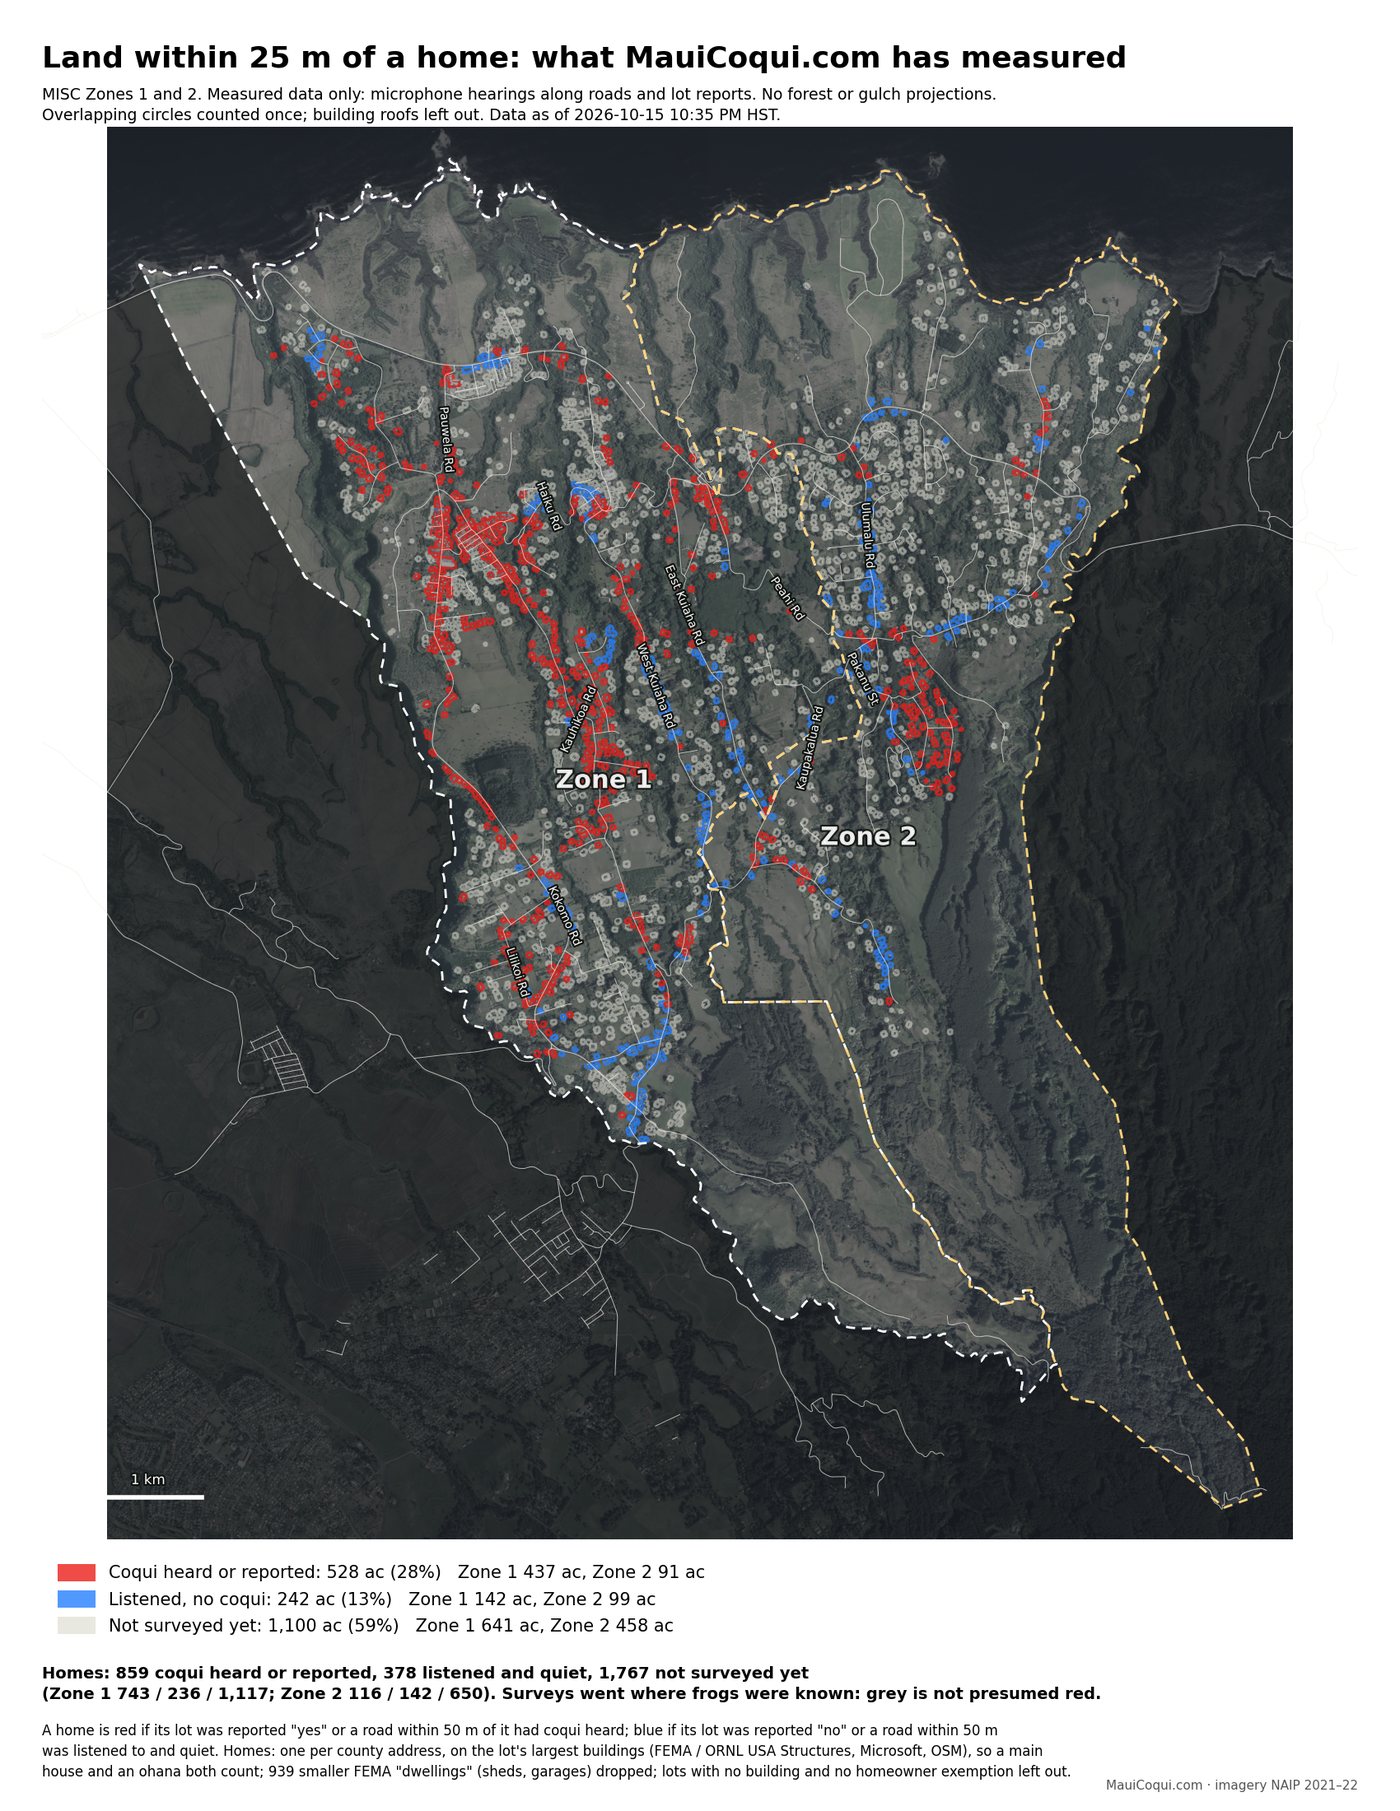
What the map actually measures
We started with about 3,000 homes in MISC’s Zones 1 and 2. Each county address counts as a home, so a main house and an ʻohana can count separately. Sheds, garages and pump houses don’t.
Each home gets one color based on the data currently available:
- Red — coqui heard or reported nearby. Someone reported coqui on that lot, or a listening survey heard coqui on a road within 50 meters of the home.
- Blue — no coqui detected. Someone reported “no coqui” on the lot, or a nearby road was surveyed under usable listening conditions without a detection. This does not establish that the property is free of frogs.
- Grey — not enough information. We don’t have a qualifying observation to classify the home either way.
There is no model predicting where the frogs should be, and we’re not automatically coloring the spaces between detections. The map reflects reports and observations, with all their limitations.
The first week’s numbers
| Area | Coqui heard or reported nearby | No coqui detected / reported | Not yet classified |
|---|---|---|---|
| Zone 1 | 743 | 236 | 1,117 |
| Zone 2 | 116 | 142 | 650 |
| Total | 859 | 378 | 1,767 |
The map also measures land within 25 meters (about 80 feet) of the classified homes, measured from each home’s walls and leaving out the buildings themselves: 528 acres associated with red homes, 242 with blue homes, and 1,100 with grey homes. Those are map areas, not measured acreage containing coqui or acreage that necessarily needs treatment.
One number jumps out: 1,767 homes haven’t been classified yet. That’s more than half the homes on the map.
We can say coqui have been heard or reported near 859 homes. We cannot say that the other 2,145 homes are free of them. Most simply don’t have the observations needed to tell us much.
What changed as I kept driving
On October 12, I reported that about 60% of the road I’d surveyed had no coqui detections. With more evenings of listening and tighter rules for when a road segment can count as a valid non-detection, that figure is now about 38% — 12 of 31 miles surveyed.
That doesn’t mean coqui suddenly spread across all those roads in a few days. The sample changed. I deliberately drove through areas where people had already told me the frogs were bad. And I’m being more careful not to label a noisy stretch “quiet” when traffic, rain or other sound could have masked the calls.
We have plenty of positive detections along Kauhikoa Road, Kokomo Road, Haʻikū Road, Hog Back Road, Lilikoi Road, Kaluanui Avenue, Pauwela Road, East Kuiaha Road and around Lanikai Place in Zone 2.
We also have stretches with no detections during the surveys: about 2.7 miles of Kaupakalua Road, roughly a mile of Awalau Road, and about 1.3 miles on the lower half of West Kuiaha Road, along with portions of Ulumalu Road, North Holokai Road, Waipalani Road, Puʻuomalei Road and Pakanu Street.
Those are useful observations. They’re not yet proof that those roads — much less every yard along them — are consistently free of coqui. Some were checked only once.
And because I chose many of the driving routes based on known activity, 38% of surveyed road mileage is not an estimate of how much of Haʻikū is free of coqui. It’s a description of the roads surveyed so far.
A detection and a non-detection aren’t the same thing
If the microphone records a recognizable coqui call, we have evidence that a frog was calling nearby at that time.
If it records nothing, there are several possibilities: no frog was there, a frog was there but wasn’t calling, it was too far away, or conditions made the call hard to hear.
That doesn’t make the non-detection useless. It just means we need to interpret it correctly. Repeated observations from different evenings are much more informative than a single pass.
There’s another wrinkle: a detection or non-detection from the road can classify multiple nearby homes. It isn’t the same as checking each of those properties separately.
Right now, only 24 lots have been specifically marked “no coqui,” compared with 513 marked “yes.” Many of those positive lot observations came from my listening drives, and so far I’m the only person who has logged a listening survey.
That’s why reports from people who actually live on these properties matter so much. Someone who listens from their own yard over multiple nights can contribute information that a passing survey vehicle can’t.
The grey areas are the biggest unknown. Absence of evidence isn’t evidence of absence — especially when nobody has looked.
What we need next
More observations. More properties reported. More roads surveyed. And, importantly, repeat visits to places already on the map.
MISC has been monitoring and managing coqui populations on Maui for years. MauiCoqui.com is a separate, community-driven way to collect and share property reports and acoustic observations. The goal isn’t to replace MISC’s work or pretend this first week of data tells the whole story.
With enough coverage over time, we may be able to see where calls are persistent, where new detections are appearing, and where neighborhoods have repeatedly reported no activity. That could eventually help neighbors coordinate and make treatment efforts more effective.
MISC’s July 2026 update makes clear that its small coqui crew can’t routinely treat every affected property. Better information won’t solve that resource problem by itself, but it could help residents make more informed decisions about what to do together.
First, though, we need to understand the distribution of the frogs without filling the gaps with assumptions.
How you can help
- Report what’s happening on your property. Claim your lot at MauiCoqui.com. If you hear coqui, report them. If you regularly listen during the evening calling hours and don’t hear any, report that too. Both observations matter.
- Add context. If you have coqui, indicate how many you’re hearing and whether you’re treating them, need help, or are surrounded by other affected properties.
- Try “Listen for coqui.” Anyone signed in can use the survey feature during the evening, on foot or during a slow drive with the windows down and radio off. The system records detections and only counts non-detections when listening conditions are good enough.
- Check again another night. A repeat observation can be more useful than a single one, particularly where the map currently shows no detections.
- Tell your neighbors. Most homes are still grey. A text, conversation or shared link may reach someone who can tell us what is actually happening on a property we know almost nothing about.
The aim isn’t to make the map look redder or bluer. It’s to make it more accurate.
MauiCoqui.com is an independent community project. Nothing is automatically sent to MISC. It’s a way for neighbors to contribute observations and build a clearer picture together.
We have one week of data. Let’s get more of it.
Sources and methods: MISC’s July 2026 “Community Update: Coqui Frog Program”; MISC FY2025 Annual Report; The Maui News, August 6, 2026; MISC Coqui Management Plan, October 2019. Home locations are derived from County of Maui address records and building footprints (FEMA / ORNL USA Structures, Microsoft and OpenStreetMap). Property reports and acoustic observations: MauiCoqui.com as of October 15, 2026, 10:35 PM. See also How to fight coqui.