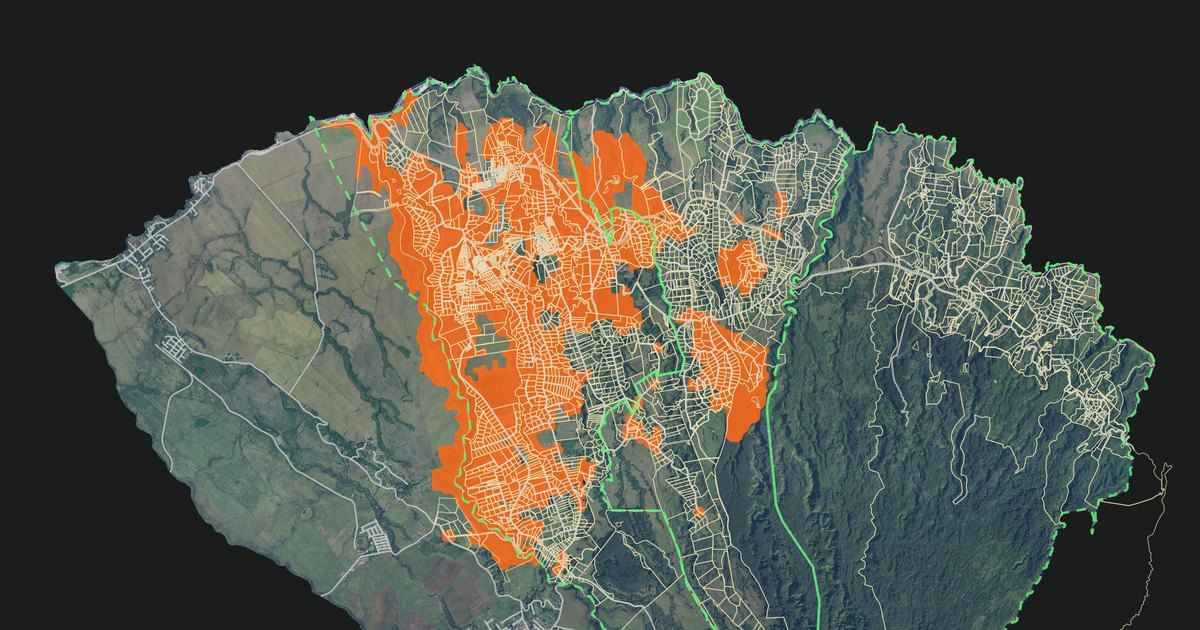
The map has a new layer that estimates where coqui are likely to be present. It shows the estimated area in orange, including the locations with coqui reports or recorded calls. If your home is inside the orange area and you hear no coqui, this post is for you.
November 3, 2026 · Tim Storm
The layer is off by default. Turn it on to see the estimated area. Turn it off to see individual reports and listening results.
Estimated coqui area near Haʻikū, shown in orange, from the current run (reports through November 2, 2026). Property boundaries, roads and MISC zones remain visible; properties reported quiet are cut out. Turn the layer off to see reports and listening results.
What the orange area shows
The layer combines coqui observations with information about the land. It estimates where coqui may be present between and near observed locations.
Orange means coqui are probably present. It does not confirm their presence at every location inside the area.
The layer uses one color. It includes both observed and estimated locations. It does not show different confidence levels within the orange area.
Property boundaries, roads and MISC zones (the zones of the Maui Invasive Species Committee) remain visible. Individual reports are hidden while the layer is on. Locations reported as quiet remain unshaded.
I hear no coqui at home. Why is my property orange?
The orange area estimates where coqui may be present. It uses nearby reports, recorded calls, and habitat data such as tree cover, rainfall, and gulches. It can include properties that nobody has reported yet.
In testing, about 9 in 10 checked squares with scores of 0.75 or higher had coqui detections. This result describes the checked squares before quiet locations and open ground are removed from the map. It does not confirm coqui at your home or on a neighboring property.
The model cannot tell when coqui might reach your property. But if your property is orange, coqui have been reported near you and the land suits them. Treat your property as next in line. If it is quiet today, your observation can improve the map.
Mark your property Quiet. Find your address, select Quiet, then Save report. No account is needed. The next published update will leave your property unshaded. This records where you heard no calls; it does not prove that coqui are absent.
Listen again after rain. If you hear coqui, update your report. A newer report replaces the older one.
Respond to the first calls. One or two frogs are cheap to remove. A chorus is not. If you hear coqui, use the How to fight coqui guide to choose your next step.
Your report adds a local observation where the model may have relied on nearby evidence.
How to turn it on
Open the map legend.
Select Layers.
Turn on Projection: where coqui probably are.
The map saves this setting on your device. Select the ? beside the layer to see its update date.
The layer is updated about once a month as new observations become available. The date under the layer name tells you which run you are looking at.
Why this layer helps
Reports and listening results do not cover every location. The layer helps identify places where more observations could improve the map, especially near the edge of the estimated area.
A quiet report inside the orange area leaves that location unshaded in the next published update. This shows where someone has listened without hearing coqui. It helps distinguish quiet observations from places with no reports.
What the layer cannot tell you
It cannot confirm coqui at every shaded location. Some locations have observations. Others are estimates based on nearby evidence and habitat.
It cannot confirm that unshaded areas are free of coqui. An area may be unshaded because of a quiet report, a low model score, limited evidence, or a rule that excludes it.
It does not give a precise result for each property. The model uses squares that are 50 meters by 50 meters. Its grid does not follow property boundaries.
It does not add to the report counts. The legend counts reports and listening results only.
It is not an agency survey or a control plan. Coqui observations come from this site. Environmental data come from the sources listed below.
A quiet report means no calls were reported during that observation. It does not prove that coqui are absent.
The model is updated as new observations become available. Quiet reports also control the display: reported quiet locations are excluded from the orange area until a newer report or detection records coqui there.
How much area is shown?
Map category
Approximate area
Area covered by coqui reports and listening detections
3,200 acres
Total orange area, including those observed locations
6,300 acres
The 6,300-acre figure includes the observed locations. It is not an additional 6,300 acres. The 3,200 acres are the ground that reports and detections cover: a reported small property as a whole, a marked location on a large property, a 100-meter road section with recorded calls, or a gulch section where calls were heard. These figures describe mapped areas, not a count of frogs or a precise measurement of occupied habitat.
The layer went live on November 2, 2026. The current run uses reports and listening results through the evening of November 2, Hawaiʻi time, and the layer shows that date. The ? beside the layer shows the date of the latest run.
Add an observation
Find your address on the map, select Yes or Quiet, then select Save report. No account is needed. These reports train the model: a report from a signed-in neighbor at full weight, a visitor's unverified report at half weight. Turn the projection layer off to see existing reports and listening results.
You can also select I hear a coqui when you hear a call. These taps are shown on the map as “not checked” and are not used to train the projection model.